
Related Articles

March 2025 Global Trade & Logistics Market Update
Ramadan 2025: Road Restrictions and Their Impact on Logistics in Abu Dhabi With Ramadan 2025 approac
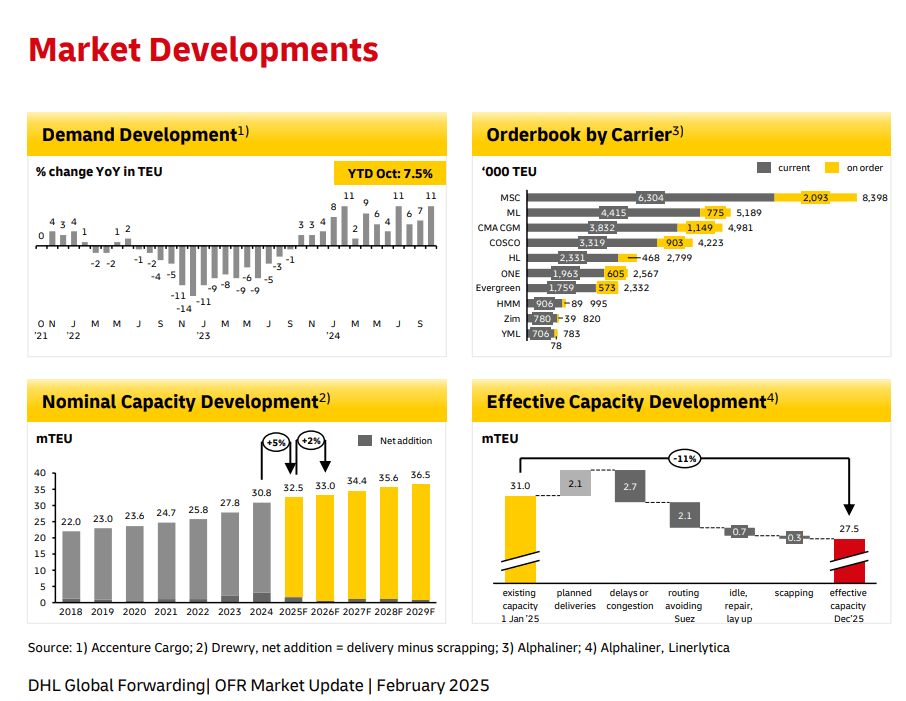
Monthly Update on the Global Logistics Market – February 2025
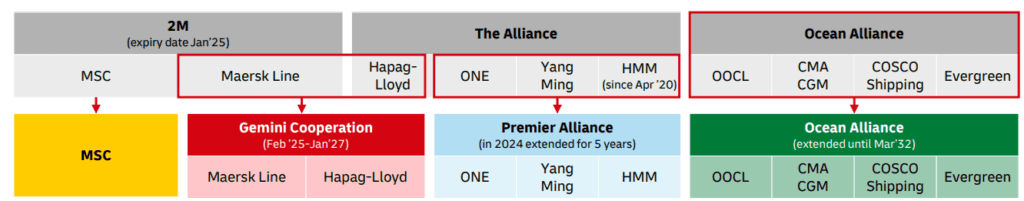
Major Shifts in Carrier Alliances Reshape Global Shipping Dynamics 2025 marks a pivotal year in the
January 2025 Supply Chain and Logistics Industry Outlook
Supply Chain Trends to Watch in 2025 In 2025, the supply chain industry is set to undergo significan
Post a comment
You must be logged in to post a comment.